DHIS2 in 2022
Analytics & Data Management
Manage and analyze aggregate and individual-level data with DHIS2’s customizable built-in tools, that can help you organize, triangulate, and bring meaning to your data
Jump to a section on this page
- Overview
- Data Management
- Data Entry & Validation
- Maps
- Charts & Graphs
- Pivot Tables
- Dashboards
- Interpretations
- Learn More
- \
Turn information into action with built-in DHIS2 analytics tools
The DHIS2 software platform includes a number of built-in features and tools to support data analysis and data management — both individually and in teams through social analytics features — and can be further extended with additional applications via the App Hub, including the Data Quality Tool, developed in collaboration with the World Health Organization. DHIS2 also offers options for exporting your data for further analysis in external platforms.
You can watch a collection of videos on DHIS2 analytics features from recent software releases below and on our YouTube channel. To browse other software feature
Data Management

DHIS2 lets you manage both individual-level and aggregate, routine data through a flexible metadata model. Everything can be configured through the user interface: You can set up data elements, data entry forms, validation rules, indicators and reports in order to create a fully-fledged system for data management, and use built-in tools to analyze your data, or export it for analysis in another platform. You can even combine data from a variety of sources and programs into a single DHIS2 data warehouse to facilitate better decision-making through data triangulation of data.
Data Entry & Validation

DHIS2 lets you capture data on a variety of devices — any computer can access DHIS2 through its web-based interface and the DHIS2 Android Capture App offers full data entry functionality on mobile devices, and the system can be configured for limited data entry by SMS. Both the web and mobile applications even work offline: If Internet connectivity drops during capture, data will be stored locally in the browser or Android application and you can continue working as before. When connectivity is back your data will sync with the online server.
DHIS2 can generate data entry forms automatically based on your data model, or you can design highly customized forms to cater for special needs. You can define auto-calculated fields inside the form, logical validation rules and set min and max values to improve data quality. With Tracker, the DHIS2 application for individual-level data, you can also create longitudinal programs that include both data capture and case management features, such as sending appointment reminders to patients by SMS or generating work lists for healthcare workers.
\
Perform geographical analysis with DHIS2 Maps

DHIS2 features awesome web-based Geographic Information System (GIS) features through the built-in Maps app, which lets you do thematic mapping of areas and points, view facilities based on classifications, visualize catchment areas for each facility, and even geolocate individual cases for contact tracing during a disease outbreak.
You can define custom legend sets and link them to indicators. The DHIS2 Maps app lets you put labels on areas and points and search and filter based on various criteria. You can move points and set locations on-the-fly. You can overlay multiple layers, use Bing Maps as background layer, and import other GIS-based data sets to allow for joint analysis with population, climate, and other data types. Maps can be saved as favorites and shared with other people, and added to your DHIS2 dashboard.
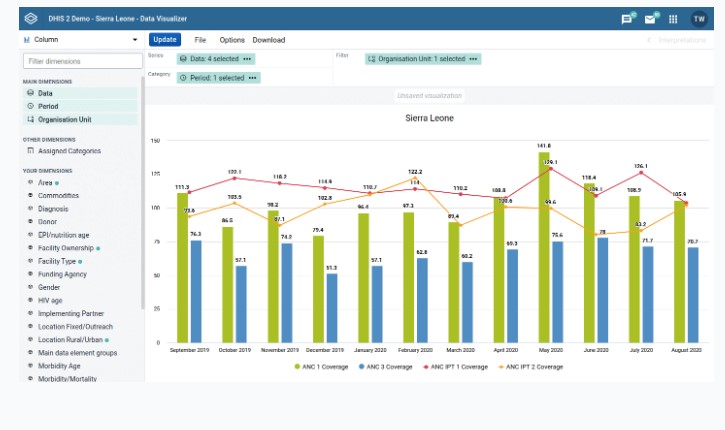
Visualize your data with charts & graphs
Analyze your data with pivot tables

DHIS2 features a fully web-based pivot table which lets you analyze data along all data dimensions and arrange these on columns, rows and as filters at demand. You can include totals and subtotals and remove empty rows, and control display density, font size and digit group separator. Pivot tables can be saved as favorites and be downloaded and used as basis for offline MS Excel pivot tables.
Get the full picture with dashboards

DHIS2 provides a personal dashboard where you can put your favorite charts, maps and reports in one place. You can search directly from the dashboard for analysis related to a particular subject or for other people. And you can click on items in the dashboard to drill down into the data for more nuanced analysis. Organizations can configure standardized dashboards that can be accessed by users across a program or project team for collaborative analysis, presented to decision makers to provide a rapid overview of program status, and even shared with the public.
The dashboard features integrated messaging functionality which lets you communicate directly with other users. From the dashboard you can view the data interpretation feed: data interpretations shared from the various analytics modules will appear here so that you can better understand your data and your organization. From the feed you can comment on other people’s interpretations and start discussions.
Share your analysis with interpretations
DHIS2 enables people to communicate and share interpretations of data. It lets you define your personal profile, write and share interpretations and comments on charts, maps and reports, and create groups of people for collaborative analysis. DHIS2 allows you to communicate with other users through the integrated messaging feature, letting you receive feedback, quickly fix issues and communicate news and updates. You can even let people self-register their own accounts.

Comments
Post a Comment